Reformatted for the World Wide Web
To RCAA Home Page
To RCAA Library
Page
Equity issues related to the geographic distribution of Seattle-Tacoma International Airport's benefits and costs underpin the requirement for socioeconomic impact mitigation. Although a source of contention, it is arguable that socioeconomic benefits such as increased economic activity (jobs, income, and output) and social/cultural events (family visits, traveling performance companies and ease of recreational travel) generated by commercial aviation services taking place at Sea-Tac International Airport exceed the Airport's socioeconomic costs (noise, traffic congestion, a degraded environment for human habitat, adversely affected educational and social services, and a reduced tax base). However, the benefits are distributed over western Washington and the Puget Sound Region while the costs are localized in a small number of communities immediately surrounding the Airport. Consequently, there is a need for mitigation that redirects some of the Airport's benefits back to the communities that disproportionately bear its costs.
Appendix A looks at the geographic area adversely affected by Sea-Tac International Airport's impacts and compares it to the places of origin of persons initiating commercial air service travel at Sea-Tac International Airport. It also analyses the Airport's economic benefits and how they affect the five impacted communities that are the focus of this study.
The data base for the origin of enplaning passengers at Sea-Tac International Airport comes from a 1991 Origin/ Destination (O/D) study conducted by the Evans-McDonough Company (EMC) for the Port of Seattle (Butler and Kiernan, September 1992). Population estimates used to calculate per capita trip generation rates were from the Washington State Office of Financial Management. Different estimates of the Airport's geographic impact area are derived from studies of Sea-Tac International Airport noise and related impacts conducted for the Port of Seattle during the past decade.
A.02 - GEOGRAPHIC AREA OF SEA-TAC'S ADVERSE IMPACTS
Numerous communities throughout the central Puget Sound region have perceived themselves adversely impacted by some factor (usually noise) connected with Sea-Tac International Airport activity levels, and there is considerable elasticity to the delineation of the geographic area primarily affected. It is widely acknowledged however that the Airport's primary adverse impacts occur in the communities immediately surrounding the Airport.
[Page A 2]
A Sea-Tac International Airport noise exposure (Part 150) study conducted for the Port of Seattle in 1989 defined the Airport's land use impact area as a rectangle extending approximately 6.2 miles north, 7.0 miles south, 1.2 miles west and 1.6 miles east of the ends of runway 16L/34R (Martin O'Connell Associates, 31 May 1994). The defined area includes all or parts of what are currently the Cities of Burien, Des Moines, Federal Way, Normandy Park, SeaTac and Tukwila plus parts of South Seattle and parts of unincorporated King County.
A 1994 "Public Building Sound Insulation Project" conducted by the Port of Seattle sent questionnaires to public buildings that might have been adversely impacted by Sea-Tac International Airport's noise. Questionnaires were sent to public buildings located in the Cities of Bellevue, Burien, Des Moines, Federal Way, Kent, SeaTac and Tukwila plus parts of South Seattle and unincorporated King County (Thomas/Lane & Associates, June 1991).
The Port of Seattle's Final Environmental Impact Statement, issued February, 1996, defines the general Study area" for analyzing impacts as a rectangle approximately 7.8 miles north and south and 1.3 miles east and west of the ends of runway 16L/34R. The area includes all or part of the Cities of Burien, Des Moines, Federal Way, Kent, Normandy Park, SeaTac and Tukwila plus parts of South Seattle and unincorporated King County.
The Airport Communities Coalition :(ACC) consists of general and special purpose local governments that have organized in opposition to the proposed Sea-Tac International Airport expansion, and they see themselves, collectively, as the primary area affected by the Airport's adverse impacts. ACC members include the Cities of Burien, Des Moines, Federal Way, Normandy Park and Tukwila plus the Highline School District.
The five Cities of Burien, Des Moines, Federal Way, Normandy Park and Tukwila covered by this SeaTac Impact Mitigation Study are clearly within the area most adversely impacted by SeaTac International Airport's operations, and they (together with the Highline School District) constitute the focus of this socioeconomic analysis.
A.03 - GEOGRAPHIC DISTRIBUTION OF PASSENGERS ORIGINATING TRIPS AT SEA-TAC
The O/D study conducted by EMC is 1991 contains responses from 3,278 originating passengers (Butler and Kiernan, September 1992). Respondents were not required to answer all questions contained in the survey. There were 3,170 responses on the data disk obtained from the Port of Seattle with usable information about trip purposes and trip origins. Respondents were asked the ZIP Code of the place where they spent the prior night (the place of origin of the trip). The ZIP Code locations were converted to city and town locations using a US Post Office ZIP Code manual. Table A.01 shows the distribution of respondents originating their trips at home, at a hotel/motel or at a business office.
[Page A-3]
| Place of Trip Origin | Number | Percent |
| Home | 1,856 | 58.5% |
| Hotel/motel | 830 | 26.2% |
| Business office | 484 | 15.3% |
| Total Respondents | 3,170 | 100.0% |
(Source: Evans-McDonough Company)
The Central Puget Sound region accounted for almost three quarters (71.9%) of all trip respondents in the survey.
The majority (58.5%) of persons originating the air portion of their trips at Sea-Tac International Airport went to the airport directly from home. Almost two-thirds (61.2%) of travelers going to the Airport directly from home were traveling for pleasure while the remaining one-third (38.8%) were traveling for business. Table A.02 presents the geographic distribution of passengers who went to the airport directly from home and who originated the air portion of their trip at Sea-Tac International Airport.
| Area | Percent of Total Originating Enplanements |
| King County | 57.2% |
| Pierce County | 10.4% |
| Snohomish County | 10.1% |
| Five Impacted Communities Combined | 5.9% |
| Thurston County | 3.1% |
| Kitsap | 3.1% |
| Rest of Washington State | 10.2% |
(Source: Evans-McDonough Company)
[Page A-4]
The five impacted cities immediately surrounding the airport that are the focus of this study accounted for 5.9% of these enplanements. King County (excluding the five impacted communities) accounted for 57.2%. Pierce County and Snohomish County accounted for 10.4% and 10.1%, respectively. In terms of large aggregates of places, King County (excluding the five impacted communities) plus Pierce, Snohomish, Thurston and Kitsap counties accounted for 83.9% of home originating enplanements; the rest of Washington State accounted for 10.2% and the five impacted communities combined accounted for 5.9%.
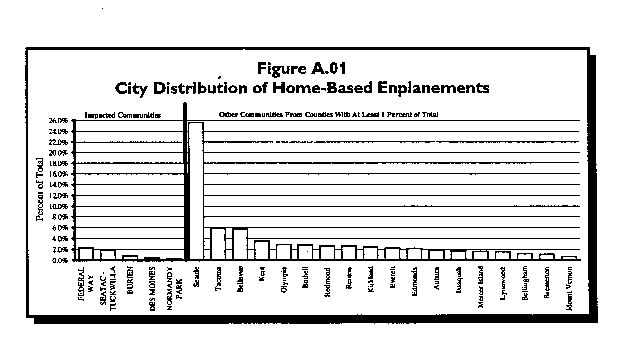
Figure A.01 compares the geographic distribution of home originating enplanements of the five impacted communities with other cities and towns located in Washington counties which generated at least 1.5% of total home originating enplanements. The Cities of Seattle (25.6%), Tacoma (5.9%), Bellevue (5.8%), Kent (3.5%), Olympia (2.9%), Bothell (2.9%), Redmond (2.6%), Renton (2.6%) and Kirkland (2.5%) all account for a larger percentage of total home originating enplanements than do any of the five impacted communities. Bellingham, located in Whatcom County and over 100 miles away from the airport generates a larger percentage of home originating enplanements than does Burien. Mount Vernon, located in Skagit County and approximately 75 miles from the Airport generates a larger proportion of home-based enplanements than do either Des Moines or Normandy Park.

Approximately a quarter (26.2%) of persons originating the air portion of their trips at Sea-Tac International Airport went to the Airport directly from a hotel or motel. just over one-quarter (25.7%) of travelers going to the Airport directly from a hotel or motel were traveling for pleasure while three-quarters (74.3%) were traveling for businesses purposes.
| Area | Percent of Total Originating Enplanements |
| King County (excluding impacted communities) | 55.9% |
| Five Impacted Communities Combined | 32.8% |
| Pierce County | 2.9% |
| Snohomish County | 2.5% |
| Kitsap County | 1.1% |
| Thurston County | 1.0% |
| Rest of Washington State | 3.9% |
(Source: Evans-McDonough Company)
Passengers Originating Trips At Business Offices
Almost one of six persons (15.3%) originating the air portion of their trip at Sea-Tac International Airport went to the Airport directly from a business office. Fewer than one in travelers (17.5%) going to the Airport directly from a business office were traveling for pleasure while more than four of five (82.5%) were traveling for businesses purposes.
Enplanements originating at business offices are highly concentrated in King County (excluding impacted communities), which accounts for just under two-thirds (66.1%) of the travelers. The impacted communities accounted for an additional 12.4%, and no other county accounted over 10%.
[Page A-6]

| Area | Percent of Total Originating Enplanements |
| King County (excluding impacted communities) | 66.1% |
| Five Impacted Communities Combined | 12.4% |
| Pierce County | 7.9% |
| Snohomish County | 6.0% |
| Thurston County | 3.7% |
| Kitsap County | 0.6% |
| Rest of Washington State | 3.3% |
(Source: Evans-McDonough Company)
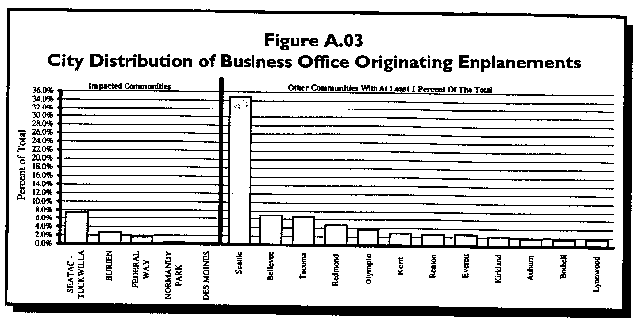
Within King County (excluding the impacted communities), the City of Seattle accounted for 58.0% of all enplanements originating at a business office, and a single downtown ZIP Code (98101) accounted for almost one-third (30.6%) of Seattle's business office originating enplanements. This pattern of concentrated business office originating enplanements was even more pronounced in the impacted communities. Over two-thirds (69.2%) of the business office originating enplanements generated within the impacted communities occurred in the SeaTac-Tukwila area, and a single ZIP Code (98188 - the same ZIP Code in which hotel/motel originating enplanements were concentrated) accounted for almost all (97.2%) of SeaTac-Tukwila's business office originating enplanements. The pattern of city concentration of business originating enplanements is shown in Figure A.03.
[Page A-7]

Dividing the number of originating enplanements in a community by the community's population and multiplying by 10,000 gives the number of home-originating trips per 10,000 population by community. The 1991 survey of originating enplanement data were divided by the State of Washington's 1991 community population estimates for the analysis of per capita originating enplanements (Butler and Kiernan, September 1992).
King County (excluding the impacted communities) generated 7.7 originating enplanements per 10,000 population. The impacted communities (combined) generated 6.8 originating enplanements per 10,000 population. No other place in the state generated over 4.0 originating enplanements per 10,000 population.
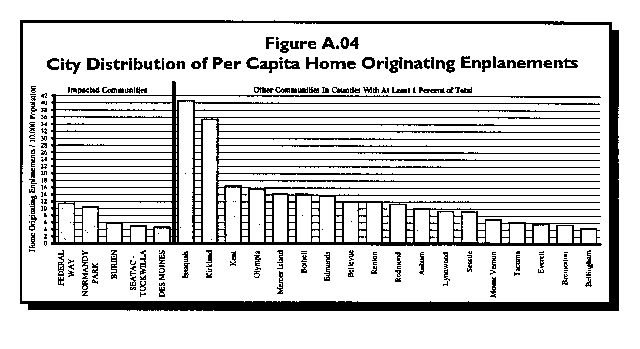
Figure A.03 shows the home trips per 10,000 population of cities and towns in counties which accounted for at least 1% of total statewide home originating enplanements. Among the impacted communities, the highest rate occurred in Federal Way at 11.5 home originating enplanements per 10,000 population. Higher rates occurred in Issaquah (40.7), Kirkland (35.4), Kent (16.4), Olympia (15.5), Mercer Island (14.2), Bothell (14.1), Edmonds (13.8), Bellevue (I 2.1) and Renton (1 2.1). The City of Mount Vernon, approximately 75 miles north of Sea-Tac International Airport, had a higher home originating enplanement rate per 10,000 population (6.9) than three of the five impacted communities.
[Page A-8]
| Area | Originating Enplanements Per 10,000 Population |
| King County (Excluding five impacted communities) | 7.7 |
| Five Impacted Communities Combined | 6.8 |
| Snohomish County | 3.9 |
| Thurston County | 3.5 |
| Pierce County | 3.2 |
| Kitsap County | 2.9 |
(Source: Evans-McDonough Company)
 A.O5 - GEOGRAPHIC MISMATCH BETWEEN AIRPORT USER BENEFITS AND COSTS
Various delineation's of Sea-Tac International Airport's primary adverse impact area exist. However, they all identify the communities and unincorporated areas of southwest King County, immediately surrounding the Airport, as the one's which suffer the primary burden of Sea-Tac International Airport's adverse impacts. These communities are impacted by the Airport's non-market costs, such as noise pollution, visual degradation, surface traffic congestion and air quality decline.
[Page A-9]
Non-market costs refer to costs resulting from operation of the Airport which are not incorporated in the price Airport users have to pay for air transportation services. They represent a transfer of value from persons living in the immediate vicinity of the Airport to persons using the air transportation services provided at the Airport.' If the same persons that suffer the Airport's primary non-market adverse impacts were either its primary users or the primary recipients of its non-market benefits, (Shapiro and Associates, April 1994), benefits and costs would be roughly in-line and no equity issue would exist.
However, an analysis of Airport users' residential and business locations reveals a "disconnect" between the Airport's benefits and costs. The five ACC communities plus the City of SeaTac, combined, account for only 5.9% of all Sea-Tac International Airport enplanements originating at the traveler's home. Cities such as Bellingham - located over 100 miles to the north of the Airport - generate a larger percentage of home originating enplanements than three of the impacted communities. The City of Seattle accounts for over four times the number of home originating enplanements than do all the impacted communities combined. In terms of per capita rates, the Cities of Issaquah, Kirkland, Kent, Olympia, Mercer Island, Bothell, Edmonds, Bellevue and Renton all generated more home originating enplanements per 10,000 population than did any of the impacted communities.
The City of Mount Vernon, approximately 75 miles to the north, had a higher home originating enplanement rate than three of the five impacted communities. The rate of home originating enplanements per 10,000 population for all the impacted communities combined was less than the rate for the rest of King County (6.8 compared to 7.7, respectively).
In terms of persons who live in the region, the impacted communities represent a small fraction of enplanements and they generate a lower rate of participation in flying than does the rest of King County.
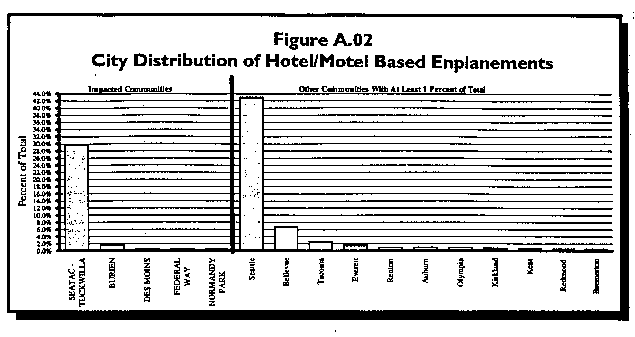
Turning to business benefits reflected by enplanements originating from hotels, motels and business offices, the area directly east of Sea-Tac International Airport along Pacific Highway South/international Boulevard generates the second largest concentration of hotel/motel originating enplanements in the region - after downtown Seattle. Even a casual inspection of the area shows these hotel/motel originating enplanements to be concentrated directly across from Sea-Tac International Airport's terminal.
Enplanements originating from business offices are disproportionately concentrated in King County (excluding the impacted communities) which accounts for almost two-thirds (66.1%) of such enplanements. The combined impacted communities account for only 12.4% of these types of enplanements. Again, most of the business enplanements originating from the impacted communities come from the area directly east of Sea-Tac International Airport along Pacific Highway South/International Boulevard.
In terms of business activity related to the Airport, the distribution of originating enplanements shows that the City of SeaTac gets some significant business activity (particularly guests at its motels), but the Cities of Burien, Des Moines, Federal Way, Normandy Park and Tukwila receive little business related benefit from the Airport.
Page A-10
Overall, residents of the communities immediately surrounding the Airport get disproportionately small benefits (both in total and per capita terms) from their use of the Airport while suffering disproportionately large costs. Business activity generated by the Airport appear to produce significant benefit for the City of SeaTac but little benefit for the Cities of Burien, Des Moines, Federal Way, Normandy Park and Tukwila.
Comparing geographic areas which receive the major benefits of Sea-Tac International Airport's air transportation services with those that suffer the primary costs (adverse impacts) leads to the inescapable conclusion that a large discrepancy exists between the costs suffered and benefits received by residents of Burien, Des Moines, Federal Way, Normandy Park and Tukwila. The discrepancy results in a lack of equity between residents of the region who primarily benefit from the Airport and residents who primarily suffer its socioeconomic costs. It causes an imbalance between populations that benefit and that suffer the cost of Sea-Tac International Airport as a major aviation center. It is an imbalance that necessitates socioeconomic mitigation by the Port of Seattle to redress.
A.06 - GEOGRAPHIC MISMATCH BETWEEN OTHER AIRPORT BENEFITS AND COSTS
An additional benefit attributable to Sea-Tac International Airport is the jobs (and income) it creates. Table A.06 shows the number of direct jobs created at Sea-Tac International Airport held by residents of the five impacted cities, and the percent of all jobs held by residents of the five impacted cities that they account for. Table A.07 shows the same information but for the indirect jobs created by the Airport in the City of SeaTac.
| City | Total Work-Trips to Airport |
Total Resident Workers |
Airport Work- Trips As Percent of Resident Workers |
| Federal Way | 911 | 40,001 | 2.28% |
| Des Moines | 436 | 14,576 | 2.99% |
| Burien | 341 | 17,312 | 1.97% |
| Normandy Park | 154 | 2,688 | 5.73% |
| Tukwila | 125 | 7,652 | 1.63% |
[Page A-11]
| City | Total Work Trips to City of SeaTac |
Total Resident Workers |
SeaTac Work-Trips As Percent of Resident Workers |
| Federal Way | 1,299 | 40,001 | 3.25% |
| Des Moines | 756 | 14,576 | 5.19% |
| Burien | 582 | 17,312 | 3.36% |
| Tukwila | 232 | 7,652 | 3.03% |
| Normandy Park | 193 | 2,688 | 7.18% |
(Source: Census Transportation Planning Package)
The analysis of Sea-Tac International Airport's direct and indirect job impacts was conducted on information provided by the Puget Sound Regional Council (PSRC) from two special data runs on the 1990 Census Transportation Planning Package (CTPP). One data run on the CTTP provided the number of work trips with origins in the Cities of Burien, Des Moines, Federal Way, Normandy Park and Tukwila that had destinations at Sea-Tac International Airport (Traffic Analysis Zone 355). The second run provided the same information for work trips that had destinations in the 13 Traffic Analysis Zones (TAZS) that lie within the City of SeaTac.
As can be seen from Table A.06, the percentage of resident workers in the five impacted communities covered by this study with direct jobs at the Airport is low - ranging from 1.63% in Tukwila to 5.73% in Normandy Park. For the five cities combined, the percent of resident workers with jobs directly at the Airport is 2.39%. The percent of City of SeaTac residents with jobs in the Airport's TAZ is 3.29%.
Table A.07 presents similar information, only for residents of the five impacted cities whose work trips have destinations in the City of SeaTac. The data in Table A.07 are presented because the City of SeaTac contains the second largest concentration of hotel/motel rooms in the region where air travelers stay immediately before departing on their trip; and might be a significant source of indirect Airport jobs for residents of the five impacted cities. As Table A.07 shows, however, this is not the case. Even if all residents of the five impacted cities parking in the City of SeaTac held indirect Airport jobs, the percent of residents affected would vary from a high of 7.18% in Normandy Park to a low of 3.03% in Tukwila. For the five impacted cities combined, the maximum percent of residents with Airport jobs is 3.72%.
More likely, the proportion is between half to three-quarters. Using the upper end of this range (0.75%), the combined direct plus indirect jobs generated by the Airport equals 5.18% of combined resident workers in the five impacted communities.
[Page A12]
The final way in which Sea-Tac International Airport might generate benefits to the five impacted cities is through their collection of property, sales and business and occupation (B&O;) taxes. For the City of SeaTac, such taxes may be a large contribution to the city's fiscal health since it contains numerous hotels, motels and office buildings which likely would not be there if not for the Airport. Additionally, the city collects taxes for automobiles that park at Sea-Tac International Airport's parking garage. The Highline School District collects business personal property taxes from the commercial airlines that operate out of Sea-Tac International Airport. The five impacted cities studied in this report plus the Highline School District all experience reduced residential property tax collections as a result of the Airport (as is discussed previously in this report) and with the few jobs and income produced by the Airport that go to residents of the five impacted cities, it is highly likely that the net effect of the Airport on tax revenue collections in the five affected cities is negative. The question of Airport-generated tax revenues in the affected cities can only be roughly estimated since the topic was not addressed in the Master Plan Update EIS and there are not any readily available sources for making estimates. Based on available data describing the travel industry, direct job and indirect job impacts generated by the Airport, it does not appear likely that Sea-Tac International Airport produces significant tax benefits for the five impacted cities.
A.07 - SUMMARY OF AIRPORT GENERATED BENEFITS AND COSTS
The working assumption of this Sea-Tac International Airport Impact Mitigation Study is that the total benefits which will result from expansion of the Airport are greater than the total costs that will be incurred. Viewed from the perspective of the entire Puget Sound region or the State of Washington, there is justification for Sea-Tac International Airport's expansion. The benefits of the Airport's expansion however are spread over the entire state and region. Relatively few of these benefits go to residents of the five Cities of Burien, Des Moines, Federal Way, Normandy Park and Tukwila. Whether benefits are measured in terms of time saving to the traveling public, direct and indirect jobs (and income) created, or tax revenues generated, the vast majority of benefits go to persons who do not reside in the five impacted cities that are the focus of this study.
On the other hand, there is evidence that the adverse socioeconomic impacts (costs) of the Airport are concentrated in the five Cities of Burien, Des Moines, Federal Way, Normandy Park and Tukwila. From the perspective of these cities, the Airport's benefits are far less than its costs.
If Sea-Tac International Airport is to be expanded, consequently, equity demands that these cities be made whole by actions designed to mitigate the Airport's adverse socioeconomic impacts and re-establish some balance between the benefits and costs which these cities will face. The fact that the Airport's total benefits exceed its total costs means that there is a margin available for such mitigation. What is required is public policy that both recognizes the magnitude of the equity issue and directs sufficient resources to restore a balance between benefits and costs facing the five impacted cities and the Highline School District.